Overview
Learn the art and science of data driven decision making. This 8 Weeks training is ideal for career newbies and professionals who aspire to familiarize and improve their marketing programs with daily commercial/business decision making tools and techniques.
In this Zoom Interactive training you will expanse over modules covering Decision Making in Business, Decision Modelling & Data Visualization, Segmentation and Profiling, Lifecycle Management and finally Contextual Marketing.
The training is structured around industry learnings and practice, all the while augmented with speaker sessions by subject experts. At the end of the course, attendees will be adept with a comprehensive understanding of how primary & secondary data are used for improved business decision making through different models, matrixes and tools.
Tools Covered


- Degree Levels: Bachelors,Masters
- Field of Studies: Information Technology
- Prior Job Experience: NA
- Other Programs:
- Business/Marketing Heads & Executives
- C-Suite Employees responsible for determining and achieving Revenue Targets
- Sales Heads & Executives
- IT employees assigned for assisting Sales, Marketing and Business Analytics Departments
- Students/graduates with business, commerce, marketing background
- Exam 77-420:Microsft Excel 2013
- SQL Relational Databases 101
Course Outline
- Week 1
- Week 2
- Vlookup/Hlookup, Match, Find & Exact functions
- Nested Loops of If conditions (SUMIF, SUMIFS, COUNTIF, COUNTIFS)
- Data Validation (Fixed, Delimited)
- Pivot table and slicer functions.
- Delamination through excel
- End goals in terms of revenue or investments etc. by using Goal Seek Solver
- Key shortcuts in excel
- Quick Analysis Tool
- Forecasting Tool
- Index Match Formula
- What is SQL
- Understanding Tables
- How do tables communicate (Concept of Keys)
- Installing PostgreSQL
- Loading a dummy database
- Selection commands
- Comparison Operators (Utilizing WHERE clause)
- Multiple conditions (using WHERE, AND, OR, BETWEEN, WHERE IN)
- Concept of NULL & IS NOT NULL and examples of how to use them
- Week 3
- Week 4
- Types of variables
- Continuous Vs Discrete Variables
- What are distributions, normal distribution, standard deviation, Skewness, Mean, Median and Mode
- Central Limit Theorem
- Population and samples
- Population distribution
- Z-Score
- Hypothesis testing
- Rejecting or accepting a hypothesis
- Assumptions for hypothesis testing
- Types of Data and appropriate Visualizations
- Types of visualizations suited for types of data
- Data Digitization and its importance in today’s corporate world
- Hands-on forecasting on datasets
- Data collection via primary and secondary data sources (Data Warehouse, Big Data)
- Single variable Linear Regression
- Forecasting tactics to take improved business decisions (Single variate, multi-variate regression)
- Multivariate Linear Regression
- Week 5
- Week 6
- Recency, Frequency, Monetary Value (RFM) framework
- Porter’s 5 Forces Model
- McKinsey 7S Framework
- Business Model Canvas
- SWOT Matrix
- GE-McKinsey 9 Box Matrix
- Boston Consultancy Group (BCG) Matrix
- PEST Analysis
- Building pricing and the psychology/economics behind it
- Hands-on segmentation on datasets
- Market sizing hands on exercise
- Determine pricing at which you can maximize profits through sensitivities
- Market Sizing
- Understanding customer segmentation
- Approaches to Market Sizing
- Week 7
- Week 8
- Microsoft Power BI
- Introduction to Power BI
- Understanding Power BI’s interface
- Walkthrough of in-built Power BI tools
- Connecting and Shaping Data
- Creating Data Models
- Calculated fields with DAX
- Common DAX Functions
- Developing reports
- Using filters with aggregate functions using HAVING
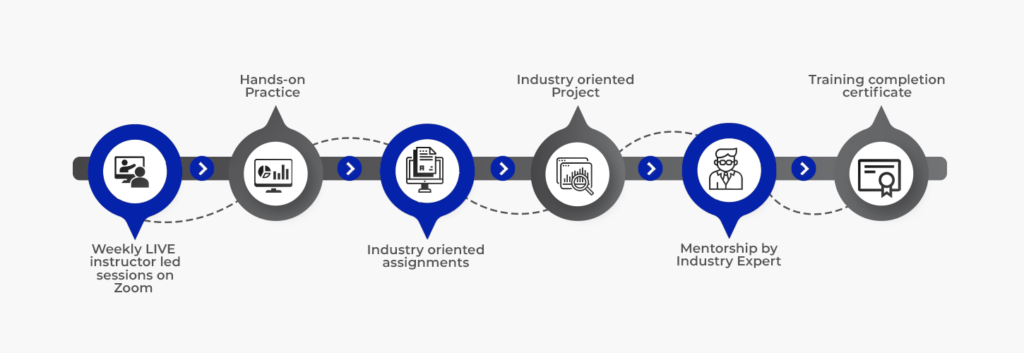
Our Methodology
Industry Usecases
With real world projects and immersive content built in partnership with top tier companies, you’ll master the tech skills companies want.
Technical Support
Our knowledgeable mentors guide your learning and are focused on answering your questions, motivating you and keeping you on track.
Career Mentorship
You’ll have access to resume support, portfolio review and optimization to help you advance your career and land a high-paying role.

Frequently Asked Questions
Yes, You will be awarded a course completion certificate by Dice Analytics if you pass the course.
Since our trainings are led by Industry Experts so it is made sure that content covered in workshop is designed with hand on knowledge of more than 70-75 % along with supporting theory.
For this professional workshop, you need to have a PC with minimum 4GB RAM and ideally 8GB RAM.
Don’t worry! We have got you covered. You shall be shared recorded lectures after each session, in case you want to revise your concepts or miss the lecture due to some personal or professional commitments.
Yes, you can rejoin the training within the span of an year of your registration. Please note following conditions in case you’re rejoining.
1) There are only 5 seats specified for rejoiners in each iteration.
2) These seats will be served on first come first basis.
3) If you have not submitted your complete fee, you may not be able to rejoin. Your registration would be canceled


