Overview
Turn the cluttered data into a visually compelling story through Microsoft Power BI!
Tools Covered

- Business/Marketing Heads & Executives
- C-Suite Employees responsible for determining and achieving Revenue Targets
- Sales Heads & Executives
- IT employees assigned for assisting Sales, Marketing and Business Analytics Departments
- Students/graduates with business, commerce, marketing background
- The learning outcomes of this workshop include gaining the ability to transform raw data into actionable insights, creating impactful dashboards and reports using advanced techniques like DAX and Power BI Visuals
- Developing a deep understanding of Business Intelligence techniques for confident decision-making.
- Participants can expect to gain hands-on experience and practical skills that can be applied in real-world scenarios
Course Outline
- Week 1
- Week 2
- Introduction to Power BI
- Architecture & Connectivity
- Power BI vs Other BI Tools
- Transform shape and model data in Power BI
- Power BI & Excel (Similar or Different)?
- Front-End Development
- Active & Inactive Relationships
- Visualizing Pakistan
- Analytics Pane (Data Forecasting)
- Bookmarking
- Analyzing Data in Dynamic Time Period
- Visualizing Geospatial Data
- Dynamically Changing Measures
- Cumulative Sum and Power BI Animations
- What if Parameters
- Using Python in Power BI
- Shape Maps in Power BI
- Advanced Tooltips
- DrillThrough
- Week 3
- Week 4
- Basics of Visualizations
- Why visualizations give output the way they are doing?
- Relationships (One to one, Many to Many, One to Many)
- Evaluation Context
- DAX (Data Analysis Expression)
- Measures vs Calculated Columns
- Aggregators vs Iterators
- Table Functions
- Answering Business QuestionsExploring Visualizations
- Formatting
- Key Performance Indicators
- Pie/Donut Chart Use and Problems
- Data Modeling
- Filter Flows
- Two Way filter flow problem
- Power Bi administration
- Publishing on Microsoft Power BI service
- Power BI dashboards
- Sharing Report
- Power BI Apps
- Live Steaming
- On-Premises Gateway
- Personal vs Enterprise Gateway
- Install and Configure Personal Gateway
- Data Automation
- Self Service with Power BI
- Quick Insights
- Embedded Analytics
- Reporting on Power BI service
- Mobile Dashboard
- Set geographic filters in Power BI for the mobile app
- User Roles
- Import and display KPIs
- Create reports and dashboards in Power BI
- Tour the report editor
- Paginated reports
- Create a paginated report and upload
- Performance tuning
- Parameters in Power BI Desktop
- Power BI Certification
- PROJECT Analyze Panama Leaks Using Power BI
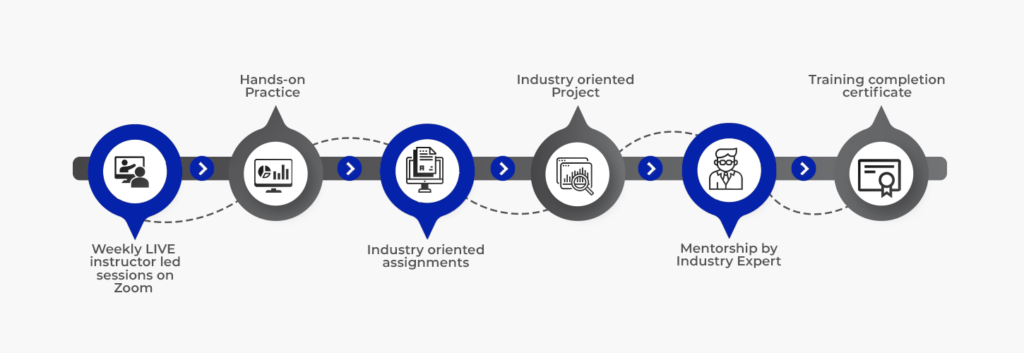
Our Methodology
Industry Usecases
With real world projects and immersive content built in partnership with top tier companies, you’ll master the tech skills companies want.
Technical Support
Our knowledgeable mentors guide your learning and are focused on answering your questions, motivating you and keeping you on track.
Career Mentorship
You’ll have access to resume support, portfolio review and optimization to help you advance your career and land a high-paying role.

Frequently Asked Questions
Yes, You will be awarded a course completion certificate by Dice Analytics if you pass the course.
For this professional workshop, you need to have a PC with minimum 4GB RAM and ideally 8GB RAM.
Since our trainings are led by Industry Experts so it is made sure that content covered in workshop is designed with hand on knowledge of more than 70-75 % along with supporting theory.
Don’t worry! We have got you covered. You shall be shared recorded lectures after each session, in case you want to revise your concepts or miss the lecture due to some personal or professional commitments.


